
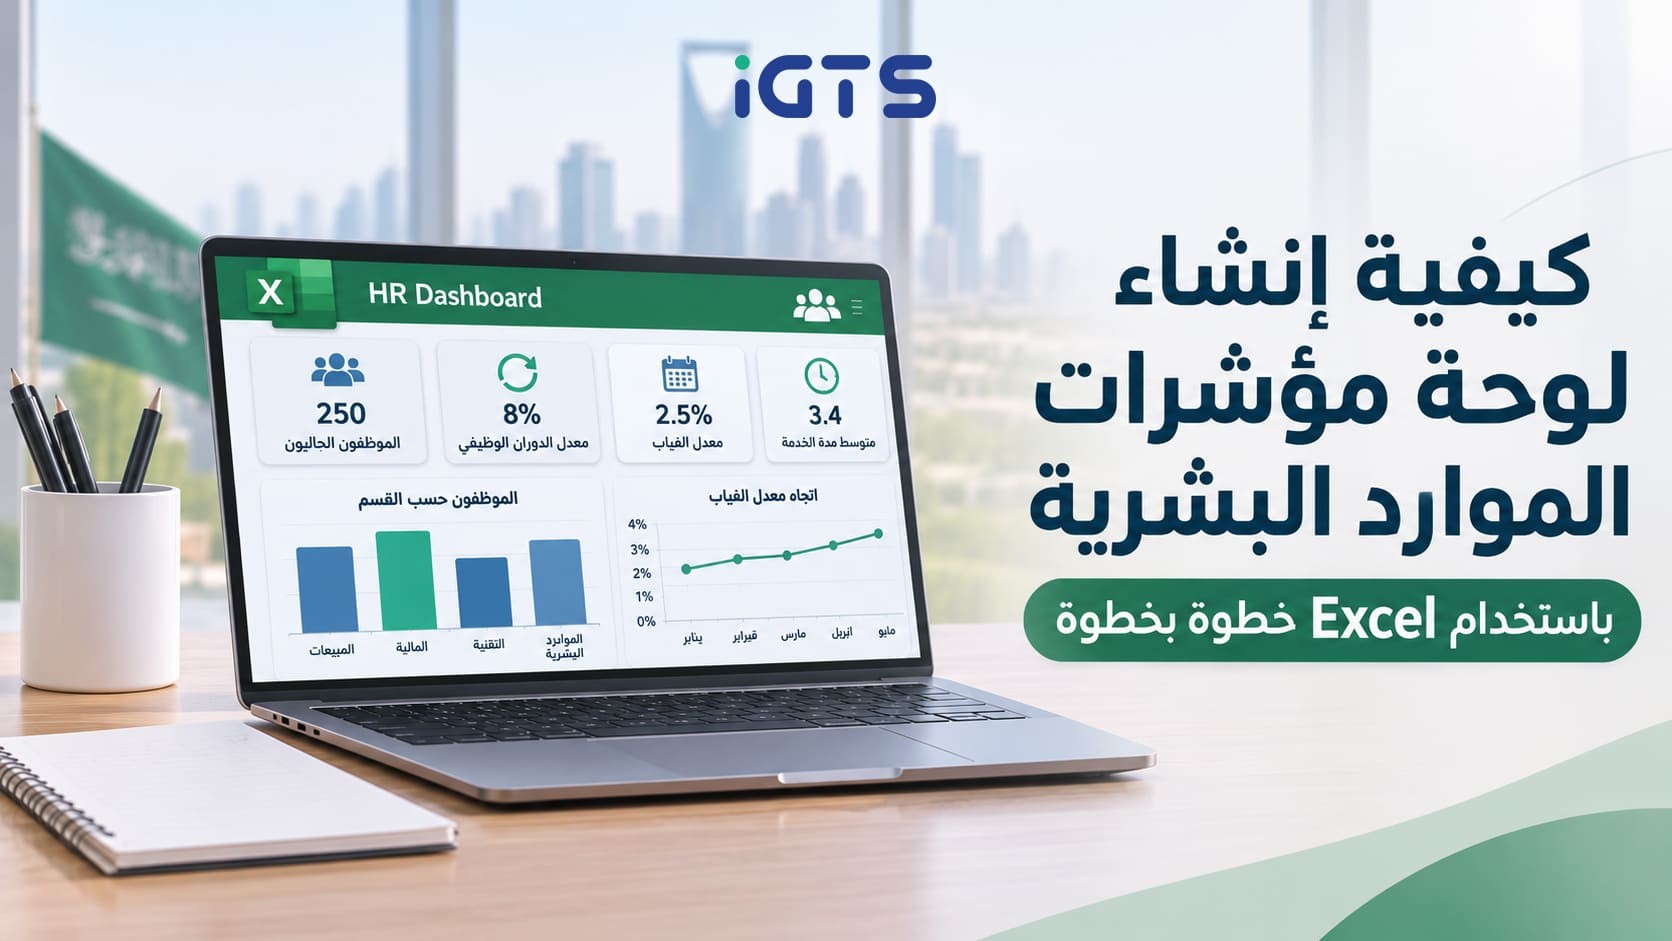
How to Create an HR Dashboard in Excel Step by Step
An HR dashboard requires organized employee data, formulas that calculate key metrics, and charts that help you analyze results in Excel. By combining these elements, you can turn scattered employee spreadsheets into one dashboard that supports performance monitoring and data-driven decision-making.
In this guide, you will learn step by step how to design an HR Dashboard in Excel, starting with selecting the right metrics and preparing your data, then writing formulas, creating PivotTables, and adding Slicers for interactive filtering. You will also find a practical example based on a fictional company and answers to common questions relevant to HR managers and employee data analysts in Saudi and Egyptian companies.
You will also learn ready-to-use formulas that you can copy and adapt to your company's metrics, whether you are a manager monitoring team performance or an HR specialist preparing monthly reports for senior management, without needing programming experience.
What Is an HR Dashboard and Why Is It Important?
An HR Dashboard is a visual dashboard that displays key human resources metrics and HR KPIs, such as employee headcount, turnover rate, absenteeism rate, and average tenure. It helps you monitor workforce performance and analyze changes over a specific period by presenting the data in one place instead of reviewing separate reports.
Quick answer: How do you create an HR Dashboard in Excel? Identify the appropriate performance indicators, organize employee data in an Excel table, and use formulas such as COUNTIFS and AVERAGEIFS to calculate the metrics. Create PivotTables and charts, add Slicers to filter by department or branch, and then combine all elements into one dashboard sheet that can be updated regularly.
Why Does Your Company Need an Employee Dashboard?
- Performance monitoring: Helps you notice changes in employee turnover or absenteeism over a specific period.
- Decision support: Provides senior management with clear indicators to evaluate HR performance.
- Time savings: Reduces the need to prepare repetitive manual reports when the data is updated correctly.
- A single reference point: Helps teams monitor metrics using organized data and consistent definitions.
How to Create an HR Dashboard in Excel Step by Step
These steps are suitable for any modern version of Excel. Follow them in order, and you will have a dashboard that can be updated every month.
Step 1: Define the Metrics and Questions You Want to Answer
Do not start with charts before deciding what you want to measure. Ask yourself: What decision will this dashboard support? Who will use it? Then select only 5 to 8 indicators. The following are common metrics that can be used as a starting point:
| Metric | Required Data | Formula | Expected Result |
|---|---|---|---|
| Current Employee Headcount | Status | =COUNTIFS(tblHR[Status],"Active") | A whole number, such as 250 |
| Employee Turnover Rate | Exit date, employee headcount | Number of leavers ÷ average employee headcount | A percentage, such as 8% |
| Absenteeism Rate | Absence days, working days | Total absence days ÷ (employee headcount × working days) | A percentage, such as 2.5% |
| Average Tenure | Hire date | =AVERAGE(tblHR[TenureYears]) | Years, such as 3.4 |
| Average Salary | Salary, status | =AVERAGEIFS(tblHR[Salary],tblHR[Status],"Active") | An amount in the local currency |
| Saudization Rate (optional for Saudi Arabia) | Nationality, status | Active Saudi employees ÷ total active employees | A percentage |
Note: If you work in Saudi Arabia, review the official definition of Saudization and the applicable calculation requirements from the Ministry of Human Resources and Social Development before using the metric in formal reports.
Step 2: Prepare Your Employee Data
Create a worksheet named Data and use one row for each employee, with clear columns such as:
| EmployeeID | Name | Department | Nationality | Gender | HireDate | ExitDate | Salary | AbsenceDays | Status |
|---|---|---|---|---|---|---|---|---|---|
| 1001 | Ahmed Ali | Sales | Saudi | M | 2022-03-01 | 9500 | 3 | Active | |
| 1002 | Sara Mahmoud | Finance | Egyptian | F | 2021-07-15 | 2026-02-10 | 8200 | 5 | Exited |
Follow these rules:
- Use one row per employee and one column per data point.
- Use one date format consistently throughout each column.
- Do not merge cells or leave empty rows.
- Use the exact same spelling for department names because even a one-letter difference creates a separate category in the analysis.
Do not use sensitive real employee data in files shared outside the relevant department, and hide salaries and employee names when presenting the dashboard to external parties.
Step 3: Convert the Data Into an Excel Table
Select any cell inside the data and press Ctrl + T. Then, from the Table Design tab, name the table tblHR. The advantage of using an Excel Table is that formulas and PivotTables linked to it can expand automatically when new employee records are added.
.png)
Step 4: Add Calculated Columns
Add calculated columns inside the table to make analysis easier:
- Tenure in Years (TenureYears):
=YEARFRAC([@HireDate],IF([@ExitDate]="",TODAY(),[@ExitDate]))
- Exit Year (ExitYear):
=IF([@ExitDate]="","",YEAR([@ExitDate]))
- Tenure Band (TenureBand):
=IF([@TenureYears]<1,"Less than 1 year",IF([@TenureYears]<3,"1-3 years","More than 3 years"))
Depending on your regional Excel settings, you may need to replace commas (,) with semicolons (;) inside formulas.
Step 5: Calculate HR KPIs in a Calculations Sheet
Create a new worksheet named Calculations and place each metric in a separate cell with a clear title. Examples include:
Current employee headcount:
=COUNTIFS(tblHR[Status],"Active")
Number of employees who left during a specific year (2026):
=COUNTIFS(tblHR[ExitDate],">="&DATE(2026,1,1),tblHR[ExitDate],"<="&DATE(2026,12,31))
Annual employee turnover rate:
=B3/AVERAGE(B1,B2)
Where B1 is the employee headcount at the beginning of the period, B2 is the employee headcount at the end of the period, and B3 is the number of employees who left.
Absenteeism rate:
=SUM(tblHR[AbsenceDays])/(COUNTIFS(tblHR[Status],"Active")*B5)
Where B5 is the number of working days in the period. Set the cell format to Percentage.
One of the easiest ways to check whether your formulas are correct is to test them on a sample of 10 employees and calculate the results manually before applying them to the full dataset.
Step 6: Build PivotTables
From the Insert tab, select PivotTable, use tblHR as the source, and place the PivotTable on a new worksheet named Pivots. Create at least three PivotTables:
- Employees by department: Place Department in Rows and EmployeeID in Values using Count.
- Average salary by department: Place Department in Rows and Salary in Values using Average.
- Employees leaving by month: Place ExitDate in Rows, group it by Months and Years, and place EmployeeID in Values using Count.

Step 7: Create the Charts
Select any cell inside a PivotTable and choose PivotChart. Use the appropriate chart for each metric:
- Column chart: Compare employee headcount across departments.
- Line chart: Track employee turnover or absenteeism over time.
- Pie/Doughnut chart: Show employee distribution by gender or nationality. It is preferable to keep the number of segments to five or fewer.
- Bar chart: Rank departments by employee turnover rate.
Remove unnecessary gridlines, add a clear title to each chart, and use only two or three main colors.
Step 8: Add Slicers for Interactive Filtering
Select one of the PivotCharts, then go to PivotTable Analyze and select Insert Slicer. Enable fields such as Department, Year, and Gender. Then use Report Connections to connect each Slicer to all relevant PivotTables so the entire dashboard responds to a single selection.

Step 9: Design the Dashboard Sheet
Create a first worksheet named Dashboard and organize it as follows:
- Top row: Large KPI cards showing key figures, with each card linked to a cell in the Calculations sheet.
- Middle section: The most important charts, ideally two to four charts.
- Side section: The Slicers.
- Formatting: Hide gridlines from View, standardize fonts and colors, and add the company logo.
For companies that work primarily in Arabic, you can enable right-to-left worksheet direction from Page Layout using Sheet Right-to-Left so the dashboard appears more natural to Arabic-speaking users.
Step 10: Update and Protect the Dashboard
When new monthly data arrives, add it to the bottom of the tblHR table and then select Data > Refresh All. After that, protect the Dashboard sheet using Review > Protect Sheet to reduce the risk of formulas being changed accidentally, and save the file in a shared folder with appropriate permissions.
Practical Example: HR Dashboard for a Fictional Company
Suppose a company called Al Ofoq Services has 250 employees working across five departments: Sales, Finance, Operations, Technology, and Human Resources. The following figures are completely fictional and are provided for demonstration purposes.
| Metric | Example Value | How to Interpret It |
|---|---|---|
| Current Employee Headcount | 250 | The actual size of the workforce |
| Employees Who Left During the Year | 20 | An initial indicator of workforce stability |
| Turnover Rate | 8% | Should be compared with the previous year and relevant industry benchmarks |
| Absenteeism Rate | 2.5% | Higher in the Operations department and worth investigating |
| Average Tenure | 3.4 years | Reflects accumulated workforce experience |
When you select the Operations department in the Slicer, all dashboard elements update automatically. The dashboard may show, for example, that the turnover rate in this department is 14%, considerably higher than the company average. This is where the HR analyst's role begins: reviewing reasons for employee departures, comparing salaries and workloads across departments, and proposing an improvement plan supported by data.
This is how the dashboard changes from a visual report into a diagnostic tool. To develop your ability to interpret these metrics and build improvement plans around them, you can explore the HR Management Diploma.
Frequently Asked Questions About HR Dashboards
What Is an HR Dashboard?
An HR Dashboard is a visual dashboard that combines human resources metrics such as employee headcount, recruitment, absenteeism, and training in one place to help users monitor results, analyze changes, and support decision-making.
Can You Create an HR Dashboard in Excel Without Programming Experience?
Yes. You can create an HR Dashboard in Excel using structured tables, formulas, PivotTables, PivotCharts, and Slicers without writing programming code.
What Data Do You Need to Create an HR Dashboard?
Basic data usually includes employee ID, department, job title, hire date, employee status, and exit date where applicable. Attendance, training, and recruitment data can also be added depending on the metrics you want to monitor.
What Is the Difference Between an HR Dashboard in Excel and Power BI?
Excel allows you to create dashboards using tables, formulas, PivotTables, and charts. Power BI offers broader capabilities for building interactive reports, connecting multiple data sources, publishing reports, and sharing them according to organizational settings. The right choice depends on the volume of data, analytical requirements, and how reports need to be shared.
How Can You Update an HR Dashboard Every Month?
Add the new month's data to the main Excel table and make sure the records are complete. Then use Refresh All to update the PivotTables and connected charts. Finally, review the metrics to confirm that the reporting period and calculation definitions have not changed.
Conclusion: Develop Your HR Data Analysis Skills
Building an HR Dashboard in Excel does not require expensive tools. You need to organize your data in a structured table, write the correct formulas, and connect them to charts and Slicers that answer the questions relevant to your management team. Start with two or three metrics, then expand the dashboard gradually as your reporting needs grow.
If you want to move beyond building one dashboard and develop a more professional approach to managing the human resources function, explore the HR Management Diploma at IGTS and review its content, enrollment requirements, and accreditation information as presented on the official program page.
Develop Your HR and Data Analysis Skills
Explore the HR Management Diploma at IGTS, or contact us to learn more about the programs that may fit your professional goals.
HR Management Diploma Contact Us on WhatsAppUpdated at: 2026-11-05 11:47:23