

Key Sales Performance Indicators (Sales KPIs) and How to Calculate Them
Is your sales team achieving the results your company is targeting, or do the number of calls, meetings, and deals fail to reflect actual revenue? Looking only at total sales is not enough to evaluate team performance. Revenue may increase while lead conversion declines, or some sales representatives may achieve their targets while stalled deals accumulate for others.
This is where Sales KPIs become important. They help you measure results, understand the efficiency of different stages of the sales process, and identify opportunities for improvement. In this guide, you will learn about the most important indicators for sales managers and representatives, how to calculate each metric, numerical examples, and a hypothetical dashboard that helps turn sales data into practical decisions.
What Are Sales KPIs?
Sales Key Performance Indicators (Sales KPIs) are quantitative measures companies use to evaluate how successfully sales activities achieve defined objectives, such as increasing revenue, converting prospects into customers, and increasing average deal value. These indicators help managers monitor team performance, identify areas where the sales process is slowing down, and determine actions that may improve results.
The appropriate indicators vary depending on the nature of the business. A company selling directly to consumers may focus on order volume and conversion rate, while a B2B company may need to monitor sales opportunity value, sales cycle length, and deal win rate.
Review our general article about KPIs.
Read Also
What Are the Most Important Sales KPIs and How Are They Calculated?
Not every company needs to monitor dozens of indicators. The most important step is choosing measures that are connected to its objectives and explain what is happening throughout the sales process. The following are some of the most important sales metrics that can be used at company, team, and individual sales representative level.
1. Sales Quota Attainment
This metric measures how close a sales representative or team is to achieving a defined sales target during a specific period, whether monthly, quarterly, or annually.
Formula:
Sales Quota Attainment = (Actual Sales ÷ Target Sales) × 100
Example: If the team's monthly target is SAR 500,000 and actual sales reach SAR 450,000:
(450,000 ÷ 500,000) × 100 = 90%
This means that the team achieved 90% of its target and still needs SAR 50,000 to reach it.
This metric helps evaluate achievement, but it does not explain by itself why a target was missed. It is therefore better interpreted alongside conversion metrics and open sales opportunities.
2. Sales Conversion Rate
The sales conversion rate shows the percentage of prospects or sales opportunities that become successful deals. It helps show how efficiently the team moves a customer from interest to a purchasing decision.
Formula:
Sales Conversion Rate = (Number of Successful Deals ÷ Number of Qualified Sales Opportunities) × 100
Example: If the team follows 120 qualified opportunities and successfully closes 30 deals:
(30 ÷ 120) × 100 = 25%
The sales conversion rate is therefore 25%.
It is important to define what you mean by opportunities in the formula. If you are measuring conversion from leads, use the number of leads as the denominator. If you are measuring deal-closing efficiency, use qualified opportunities that reached the relevant evaluation stage. Do not mix the two stages when comparing results.
3. Average Deal Size
This metric measures the average revenue generated by each successful deal and helps you understand the value of the deals being closed rather than only their quantity.
Formula:
Average Deal Size = Total Value of Successful Deals ÷ Number of Successful Deals
Example: If the team closes 20 deals worth a total of SAR 300,000:
300,000 ÷ 20 = SAR 15,000
The average deal size is therefore SAR 15,000.
This metric can help evaluate upselling and cross-selling opportunities. However, a higher average deal size does not necessarily mean overall performance has improved if it is accompanied by a significant decline in deal volume or profit margin.
4. Sales Cycle Length
Sales cycle length measures the average time the team needs to convert a sales opportunity into a successful deal, beginning from the stage the company defines as the starting point and continuing until the sale is completed.
Formula:
Average Sales Cycle Length = Total Number of Days Required to Close Successful Deals ÷ Number of Successful Deals
Example: If five deals take 10, 15, 20, 25, and 30 days to close:
(10 + 15 + 20 + 25 + 30) ÷ 5 = 20 days
The average sales cycle is therefore 20 days.
Monitoring this metric helps identify whether deals are taking longer than usual and which stages may need improvement, such as delays in submitting proposals or lengthy approval procedures.
5. Win Rate
Win rate measures the percentage of sales opportunities that ended in successful deals out of all opportunities that were closed, whether won or lost. It is an important indicator for understanding the team's ability to compete and complete sales.
Formula:
Win Rate = (Number of Won Deals ÷ Total Closed Deals) × 100
Example: If the team closes 50 sales opportunities, including 15 won deals and 35 lost deals:
(15 ÷ 50) × 100 = 30%
The win rate is therefore 30%.
Do not include opportunities that are still open when calculating this metric because their outcome has not yet been determined. The definition of a closed deal should also be standardized across the sales team to ensure accurate comparisons.
6. Sales Pipeline Value
The sales pipeline refers to all sales opportunities the team is currently working on at different stages of the sales process. Monitoring its value helps provide a view of potential business that may become future revenue.
Formula:
Sales Pipeline Value = Sum of the Expected Values of All Open Sales Opportunities
Example: Suppose the team has four open opportunities valued at SAR 20,000, SAR 35,000, SAR 40,000, and SAR 55,000:
20,000 + 35,000 + 40,000 + 55,000 = SAR 150,000
The open sales pipeline value is therefore SAR 150,000.
Remember that this value does not represent guaranteed revenue. The opportunities are still being pursued and may be won, lost, or moved into a later reporting period.
7. Sales Rep Productivity
Sales representative productivity helps measure the results achieved by each representative during a specific period. Depending on the nature of the business and the objective, it can be measured through revenue generated per representative or the number of successful deals.
Suggested formula:
Sales Rep Revenue = Total Sales Value Attributed to the Representative During the Period
Example: If one representative generates SAR 120,000 in sales during a month while another generates SAR 90,000, their results can be compared while taking into account differences in customer size, available opportunities, and sales territories.
It is better not to rely on revenue alone when evaluating representatives. One representative may close large deals after a long sales cycle, while another may complete a greater number of smaller deals.
8. Sales Forecast Accuracy
Sales forecast accuracy measures how close the revenue forecast made by the sales team is to the actual results. It helps management improve planning and estimate future revenue and resource requirements.
Simplified formula:
Forecast Accuracy = [1 - (Absolute Difference Between Forecast and Actual Sales ÷ Actual Sales)] × 100
Example: If the team forecasts sales of SAR 200,000 but actual sales reach SAR 180,000:
[1 - (20,000 ÷ 180,000)] × 100 = approximately 88.9%
Forecast accuracy according to this formula is approximately 88.9%.
Make sure actual sales are not zero when using this formula, and agree on a consistent method for measuring forecast accuracy within the organization because some companies use different metrics to measure forecast error.
Quick Table of Key Sales KPIs and Formulas
| Sales KPI | Calculation |
|---|---|
| Sales Quota Attainment | Actual Sales ÷ Target Sales × 100 |
| Sales Conversion Rate | Successful Deals ÷ Qualified Opportunities × 100 |
| Average Deal Size | Value of Successful Deals ÷ Number of Successful Deals |
| Sales Cycle Length | Total Days to Close Deals ÷ Number of Deals |
| Win Rate | Won Deals ÷ Closed Deals × 100 |
| Sales Pipeline Value | Sum of Open Opportunity Values |
| Sales Rep Productivity | Sales Attributed to the Representative During the Period |
| Forecast Accuracy | 1 - (Absolute Difference ÷ Actual Sales) × 100 |
How to Build a Sales Dashboard and Use KPIs to Improve Team Performance
The real value of KPIs lies in the decisions you make based on them, not in how many metrics you track. Follow these steps:
- Define the decision first: Are you trying to increase revenue, shorten the sales cycle, or reduce cost? Select indicators based on the answer.
- Select 5 to 7 indicators: Combine lagging indicators that measure completed results, such as revenue, with leading indicators that precede results, such as new opportunities and meetings.
- Standardize definitions: Agree with the team on what a “qualified opportunity” means and when a deal is considered closed so that numbers do not vary between representatives.
- Collect CRM data regularly: Avoid scattered manual data entry whenever possible.
- Set a review rhythm: Review leading indicators weekly and results indicators monthly.
- Analyze differences: Compare representatives, products, channels, and periods and investigate the reasons behind performance differences.
- Turn results into action: This might involve a training plan, changing opportunity distribution, or reviewing pricing, followed by monitoring the impact in the next month.
The dashboard can be built in Excel, CRM dashboards, or analytics tools such as Power BI. The most important factor is selecting the right metrics and analyzing them.
Example of a Hypothetical Sales Team Dashboard
The proposed dashboard consists of three layers: top-level KPI cards for revenue, quota attainment, conversion rate, win rate, average deal size, and sales cycle length; a chart comparing revenue with the target across months; and a chart showing the win rate for each sales representative.
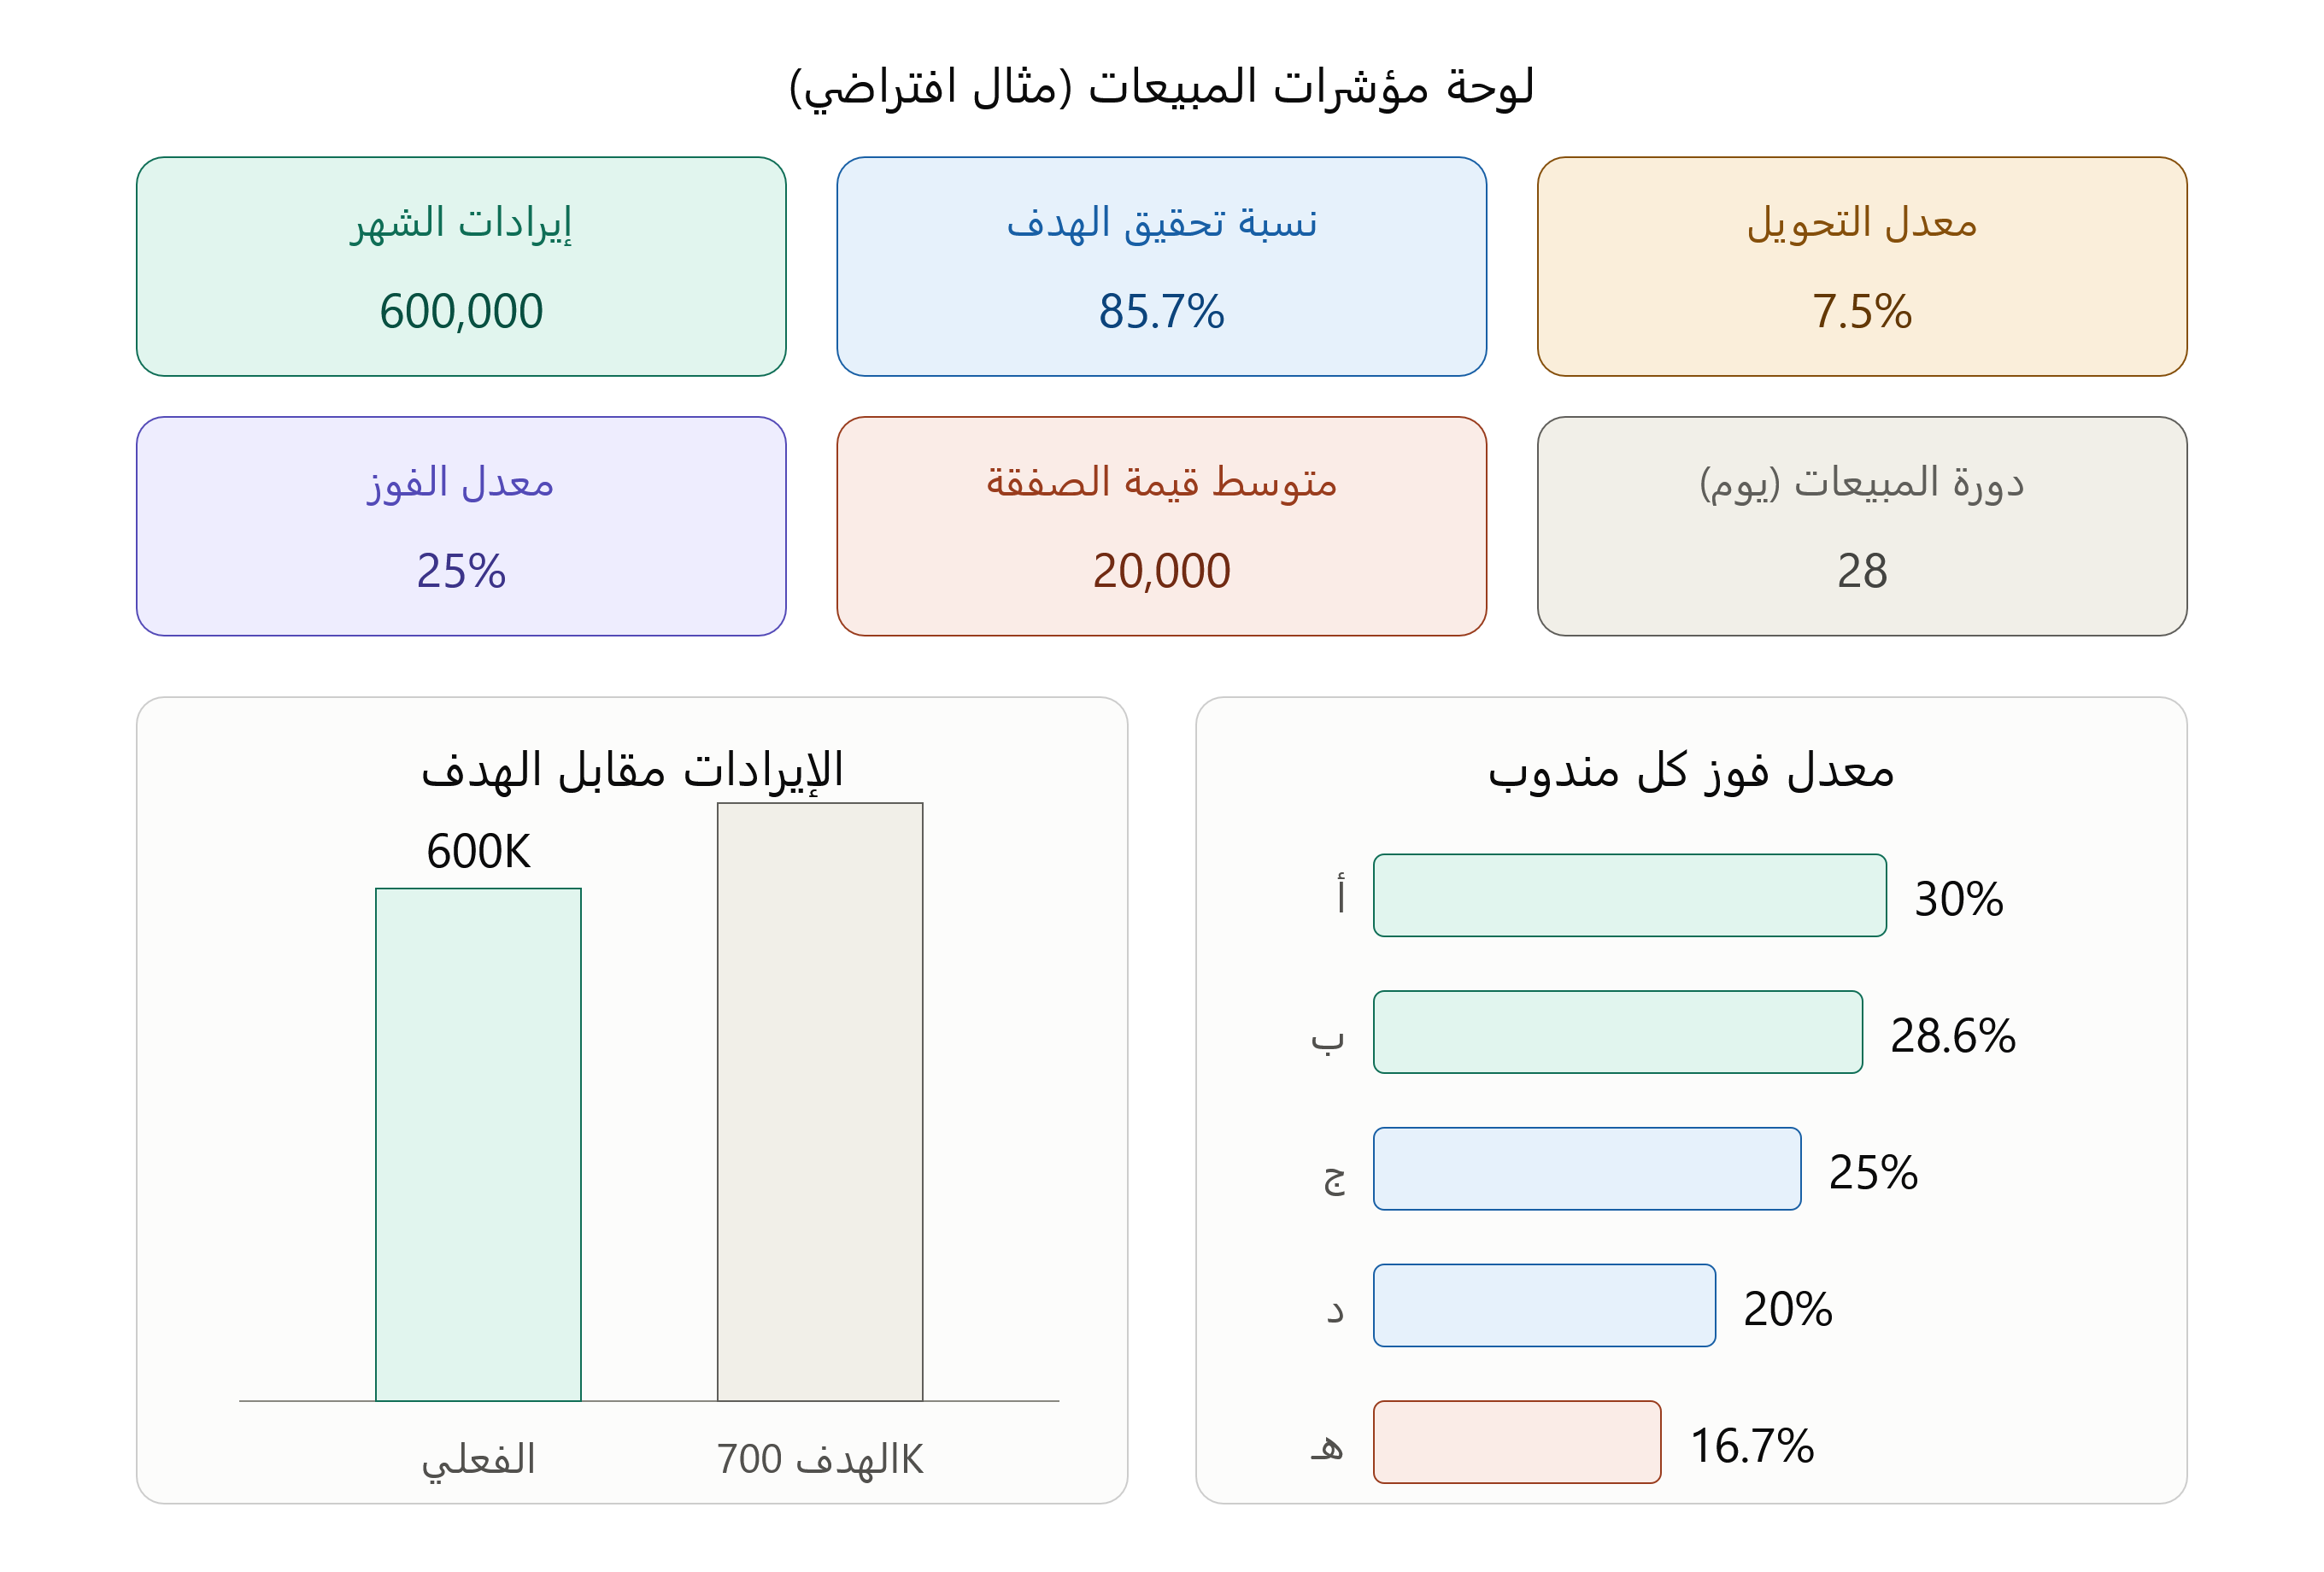
When reviewing the dashboard, the team appears close to its target at 85.7%, the largest drop in the sales pipeline occurs between opportunities and deals at 25%, and one representative's win rate is significantly below the average. This is where a number becomes a decision: review closing skills and opportunity quality before increasing spending on lead acquisition. For more content on leading sales teams, review our sales management articles and the complete sales topic hub.
Frequently Asked Questions About Sales KPIs
What Are the Most Important Sales KPIs?
Key sales KPIs include sales quota attainment, lead conversion rate, average deal size, win rate, sales cycle length, and sales pipeline value. The right indicators depend on the nature of the business and the company's objectives.
How Do You Measure a Sales Representative's Performance?
You can measure a sales representative's performance by comparing actual sales with their target and monitoring successful deals, qualified opportunity conversion rate, average deal value, and deal-closing time. It is better to combine outcome indicators with sales-stage indicators while considering differences in opportunities and customers between representatives.
What Is the Difference Between a KPI and a Goal?
A goal is the result a company wants to achieve, such as increasing sales by 15% within six months. A Key Performance Indicator (KPI) is the metric used to monitor progress toward that goal, such as revenue growth rate or sales quota attainment.
How Do You Prepare a Monthly Sales Report?
Start by defining the reporting period, then collect actual sales data, targets, won and lost deals, and open opportunities. Calculate the main indicators, compare the results with the previous month and defined targets, and then add a summary explaining the most important changes, their causes, and recommended actions for the following month.
Conclusion: Turn Sales KPIs Into Decisions That Improve Results
The importance of Sales KPIs goes beyond knowing total revenue or the number of deals that have closed. These indicators help you understand team efficiency, monitor the stages of the sales process, identify causes of underperformance, and improve future forecasting. The more closely indicators are connected to clear objectives and accurate data, the more grounded your decisions become.
If you want to develop your skills in planning, implementing, and managing sales activities while strengthening your negotiation, persuasion, and sales-team leadership skills, you can explore the Sales Managers & Supervisors Diploma at IGTS and review its training content and modules as the next step in developing your professional sales expertise.
Develop Your Sales Management Skills
Explore the Sales Managers & Supervisors Diploma at IGTS, or contact us to learn more about the training program.
Sales Managers & Supervisors Diploma Contact Us on WhatsAppUpdated at: 2026-11-10 16:11:59